Freva - Data search and analysis framework for the Community

by: Andrej Fast, Brian Lewis, Christopher Kadow, Etor Lucio Eceiza, Mahesh Ramadoss, Martin Bergemann and many others
Common Problem I: Finding Data

Common Problem II: Use code of others

Common Problem III: Reproducibility

- How can we search and access various datasets efficiently?
- How can we streamline user data analysis tools (reusable and reproducible)?
Yet another solution: 
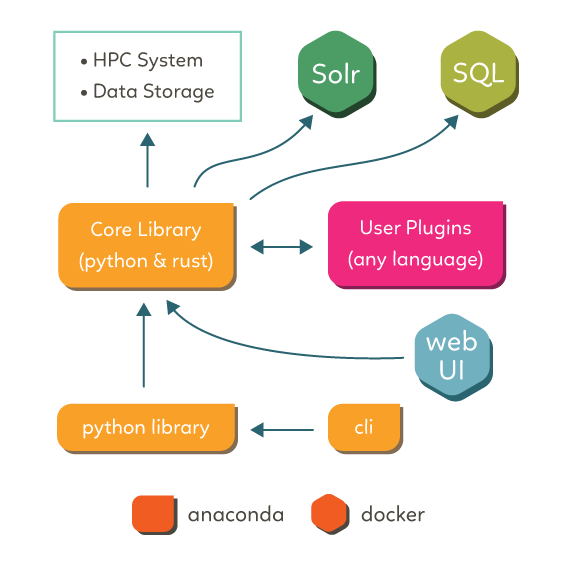
- The freva framework and its three layered architecture
Freva's architectue

Example I: Searching and reading CMIP6 data
I. Python call:
import freva
import xarray as xr
files = freva.databrowser(
    project="cmip6",
    experiment="historical",
    model="mpi*",
    ensemble="r1i1*",
    variable="tas",
    time_frequency="mon"
)
dset = xr.open_mfdataset(files, combine="by_coords", parallel=True)
II. Command line call:
⋊ freva databrowser project=cmip6 experiment=historical model='mip*' ensemble='r1i1*' time_frequency=mon variable=tas
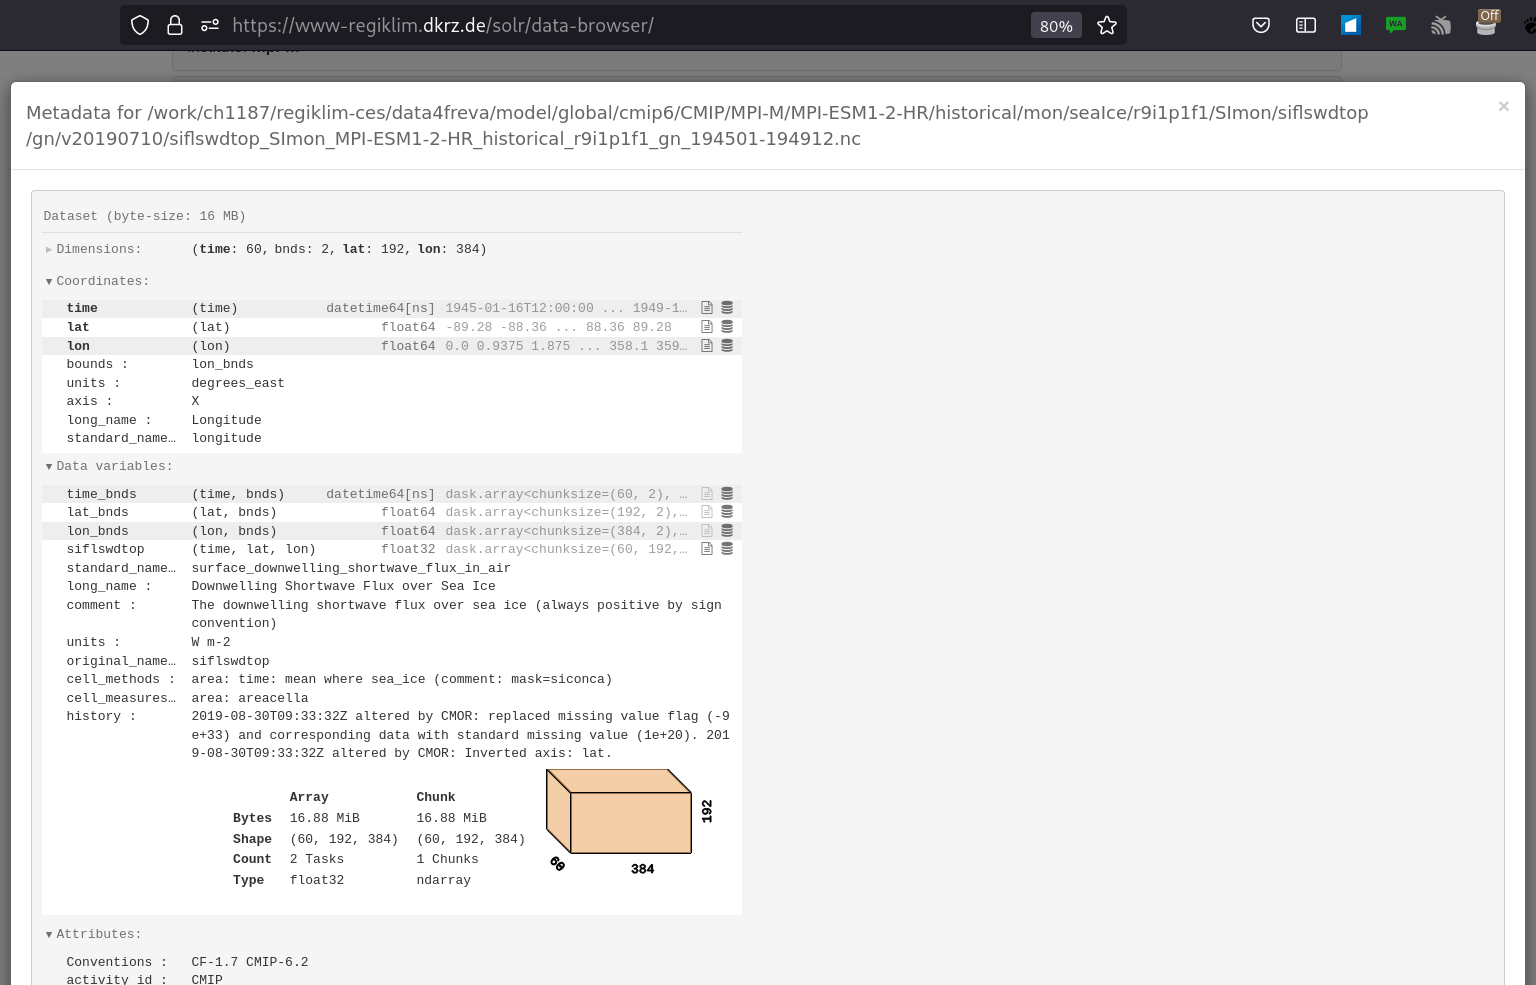
III. Web user interface:
Inspecting metadata from the web:

Example II: Data analysis tool / plugin
Get climate change signal and uncertainty in a German municipality
- How to create a multi-model ensemble?
- Where is the data for the ensemble?
- How to select the municipality area?
- How to provide a simple user interface for others?
- ...
Solution: Create a freva plugin.
Plugin config: Left cli - Right web
View the plugin results from the web

Task: Setting up a new data analysis tool
- Freva plugin API is code agnostic
- Yet: User plugins have to be defined and configured within the python API wrapper:
Outline of the freva API wrapper code
from evaluation_system.api import plugin
from evaluation_system.api.parameters import File, ParameterDictionary, SolrField
class PlottingTool(plugin.PluginAbstract):
"""Plugin that plots content of selected data."""
# Plugin setup
    tool_developer = {"name": "Jane Doe", "email": "Jane.Doe@example.com"}
    __category__ = "support"
    __short_description__ = "Plot data"
    __version__ = (2022, 1, 1)
    __parameters__ = ParameterDictionary(
        File(
            name="in_file",
            file_extension="nc",
            mandatory=True,
            help="Select the input netCDF file.",
        ),
        SolrField(
            name="variable",
            mandatory=False,
            facet="variable",
            help=("Select the variables(s) to be plotted"),
            max_items=1,
        )
    )
This will become more simple in the future
# Workflow definition of the actual tool
 def run_tool(self, setup: dict[str, str]) -> None:
        """This method calls the actual plugin."""
        self.call(
          f"python src/plot_map.py {setup['in_file']} -v {setup['variable']}"
        )
Plugin command line interface with the new tool:
⋊  freva plugin -l
Animator: Animate data on lon/lat grids
ClimateChangeProfile: Create climate change signals.
ClimDexCalc: Calculate the ETCCDI climate extreme indices on the
             basis of daily temperature and precipitation data using
             the ClimDex software provided by PCIC.
Climpact: Process climate model data for input of impact model
CWT: Calculate Circulation Weather Type by mean sea level pressure.
EnsemblePlotter: Create and Plot maps of multi-model ensemble means and
                 standard deviations
MoviePlotter: Plots 2D lon/lat movies in GIF format
Papermill: Parametrize a given notebook
PlottingTool: Plot data
⋊  freva plugin plottingtool --doc
PlottingTool (v2022.1.1): Plot data
Options:
in_file  (default: <undefined>) [mandatory]
         Select the input netCDF file.
variable (default: <undefined>)
         Select the variables(s) to be plotted
A couple of additional features:
- Users can search their own plugin history and other users results
- Web UI suggests similar results on plugin config
- Full integration of 8 different workload managers (slurm, pbs, lfs ...)
What's next?
Moving into the cloud

- Different Data Sources:
- Cloud storage formats (Amazon S3/Swift)
- ECMWF fdb5 data storage
- Tape archives
- Better plugin workflows by integrating the common workflow language (cwl)
- Simplifying the plugin API wrapper
Containerising the User Plugins

- Advantages:
- Host architecture independent (sort of)
- More secure (sort of)
- Better reproducibility than anaconda
- Scalable solutions (kubernetes, docker swarm etc)
- Easier workflows with toil and the common workflow language